Tuesday April 21, 2020, the Youtube channel 3Blue1Brown streamed a video lesson using the unit circle to graph the cosine function. We wlll now travel to the home of an ANIMATED unit circle. You can play with the circle yourself and create a table of x-y values from points on the unit circle. I will show you how he used those points to build the WAVY COSINE function. We can even use those same points to build the SINE function graph. I hope you enjoy it.
First we will make a table with 3 columns. First column is the angle (distance we walk around the circle). SEE my prior lesson if you do not know about the circumference of the circle whose radius is 1. And the second column is the x-value of the point. The third column is the y-value of the point.
Draw a large circle. Use a coffee mug and mark its center. Also draw a table with 3 columns. See my orange one in diagram. You can easily complete the WHOLE TABLE by visiting the web address listed below. READ the directions in this diagram first. You will enjoy the animated circle. You can quickly complete the 3-column table by using it. Please fill in the angles and then the x and y.
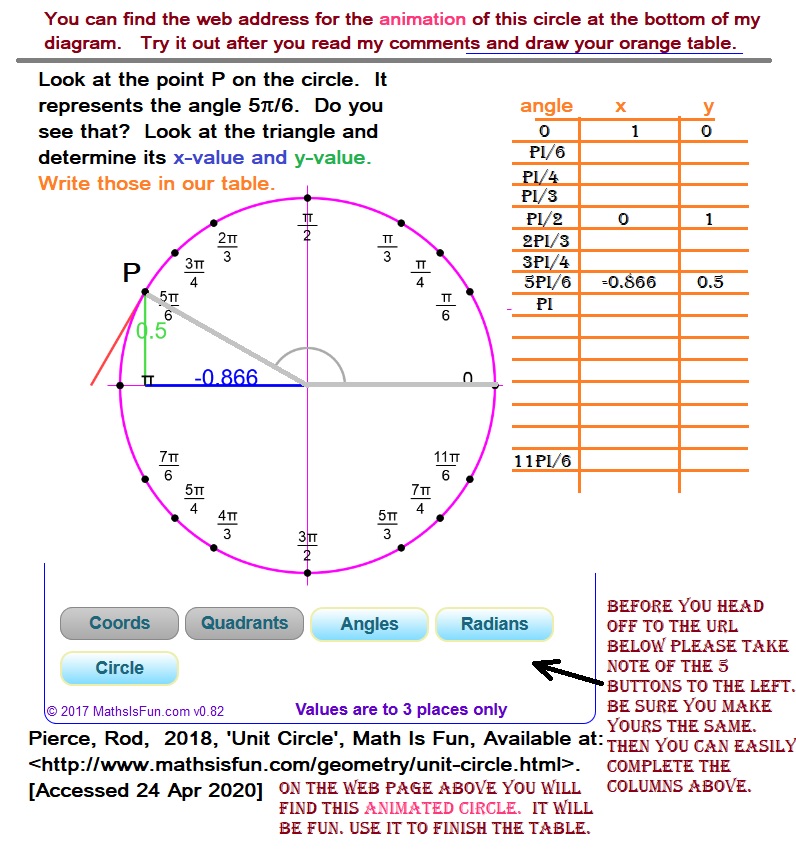
The web page is www.mathisfun.com/geometry/unit-circle.html Scroll down a bit and you will see the circle. Be sure to have the 5 buttons set properly. Then draw your table and complete it.
You will now graph the cosine function! Make a second table with two columns then we will use the orange table that you completed to fill it. Use the angle column for the first column and the second column will be the x column. I guess you could just cover-up the y column. Now draw a very long x-axis and short y-axis on your graph paper. Oops! I forgot to ask if you have any, well, you can find that with Google. Be sure the x-axis has RADIANS marked for you. Or you can use this:
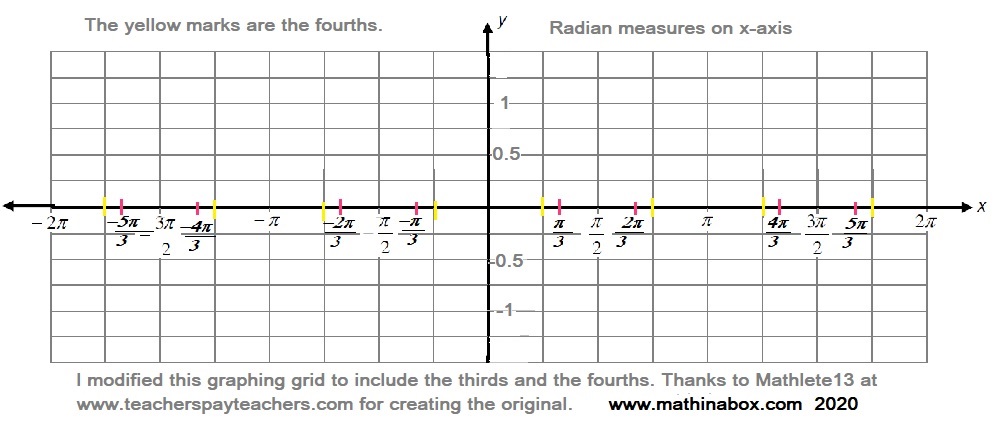
Do you see the radians on the x-axis? And do you have on the y-axis +1 and -1, of course in the proper places. You can now plot your points on the graph paper or x-y axes. When you have all the points completed try to make a smooth curve (wavy) through your points. We will have only a portion (its called 1 period) of the COSINE function. The function is symmetrical: it has a pattern you could say so draw it longer to the left if you like. NOW you know how the COSINE function is graphed using points from the UNIT CIRCLE.
If you will create another 2 column table and use the angle column and y-value column then you can graph the SINE function. You will use the same type of grid. You will notice that the sine function has the same wavy shape as the cosine function but that it crosses the x and y axes at different points.
In this lesson I have not asked you questions, and expected an answer, to help you digest the material. Completing this activity should be sufficient to tell you if you understand. If you have questions or get stuck please email me from Contact page or ask in the comment box below. You can, of course, use Google to find a completed cosine and sine function. But I hope you will complete this activity yourself. SOJ